AI-agent-powered operations platform.
How I redesigned DriveHub: a single web platform where supervisors can manage routes, resolve credits, handle late loads, monitor customer satisfaction, create driver schedules, and get AI-powered guidance — keeping the human in the loop, without ever leaving the tab.
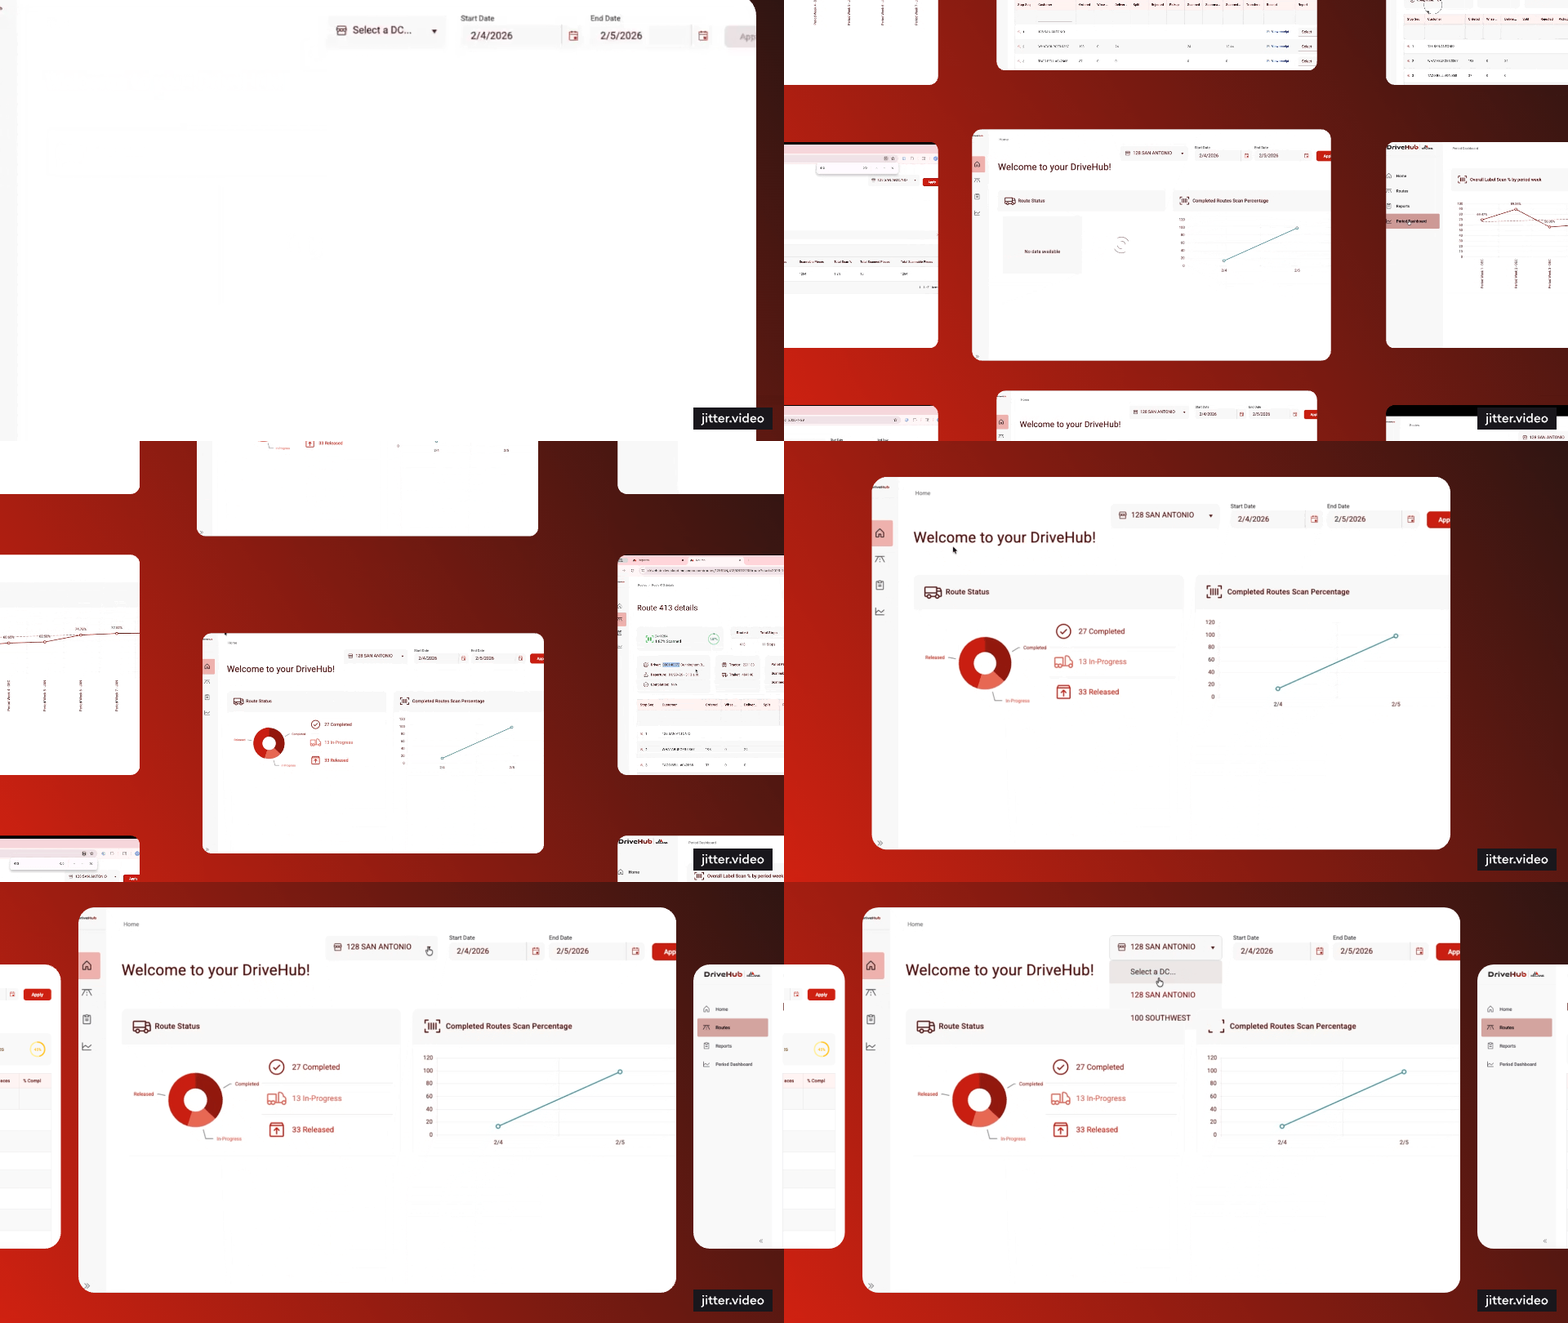
Overviewone operations team, a dozen disconnected tools.
McLane Company is one of North America’s largest grocery and foodservice supply-chain distributors. Behind every route, every delivery, and every credit dispute is a transportation supervisor making time-sensitive decisions under pressure — often without the tools to make those decisions well.
DriveHub is the platform built to change that. It serves as McLane’s central operations hub for the Retail and Restaurant Divisions — connecting to Drive360 (the driver-facing mobile app) and integrating with every internal system the DC team relies on: credits, returns, customer data, driver scheduling, delivery statuses, customer satisfaction, and much more.
My role & responsibilities
As Product Designer, I owned the experience from first research session to final handoff — including the design system that holds it all together and the AI layer that makes it proactive. My responsibilities included:
- Leading UX research — mapping the full transportation supervisor journey across nine functional areas, surfacing 34 gaps, and ranking them by severity before a line of code was written.
- Designing the end-to-end platform — home dashboard, route management, stop-level tracking, proof of delivery, credits & disputes, late-load management, real-time alerts, customer satisfaction, reporting, and the Ask Mac! AI assistant.
- Defining the AI experience — contextual AI copilots, inline intelligence, voice search, and AI-generated insights that make the platform proactive rather than reactive.
- Defining review guidelines and quality guardrails for the AI agent workflows behind driver scheduling, credit approvals, RMA processing, delivery-delay / weather-traffic rerouting alerts, and proactive delivery notifications — developed jointly with BAs, data scientists, and engineering.
- Building and governing the design system — a tokenized library (Satoshi & Archivo, McLane red, Phosphor icons, Kendo spacing) that keeps every module visually consistent at scale.
- Partnering cross-functionally — collaborating with product, engineering, DC operations, and L&D to keep design grounded in operational reality.
The challengethe work and the tools were in different places.
Transportation supervisors consistently described the same experience: starting the shift by opening a dozen tabs, then spending the day manually connecting information that should already be connected. Research surfaced four root problems:
Fragmented experience
Routes, credits, training, and customer communications each lived in a separate system with its own login and logic. Nothing talked to anything else. Supervisors were the integration layer — doing by hand what software should do automatically.
Reactive, not proactive operations
Traffic delays, extreme weather, and late loads were discovered through phone calls rather than alerts. No intelligence layer could see a problem forming and surface it — let alone suggest what to do about it.
Slow, opaque credit handling
When a delivery arrived short or damaged, the credit process started a manual paper trail with no visibility, no audit history, and no pattern recognition. Supervisors couldn’t tell whether a claim was unusual or a symptom of a recurring issue.
No unified analytics
Performance data, scan rates, customer ratings, and delivery receipts lived in separate exports. Building any cross-functional view meant a spreadsheet, a wait, and a guess.
"Supervisors don’t have spare attention. Every feature had to earn its place in the flow of a busy shift — surface the right thing at the right moment, then get out of the way."
Researchmapping the whole journey before drawing a screen.
I led a multi-pronged discovery effort to ground the redesign in how transportation supervisors actually operate — not how the legacy systems assumed they did.
End-to-end journey map
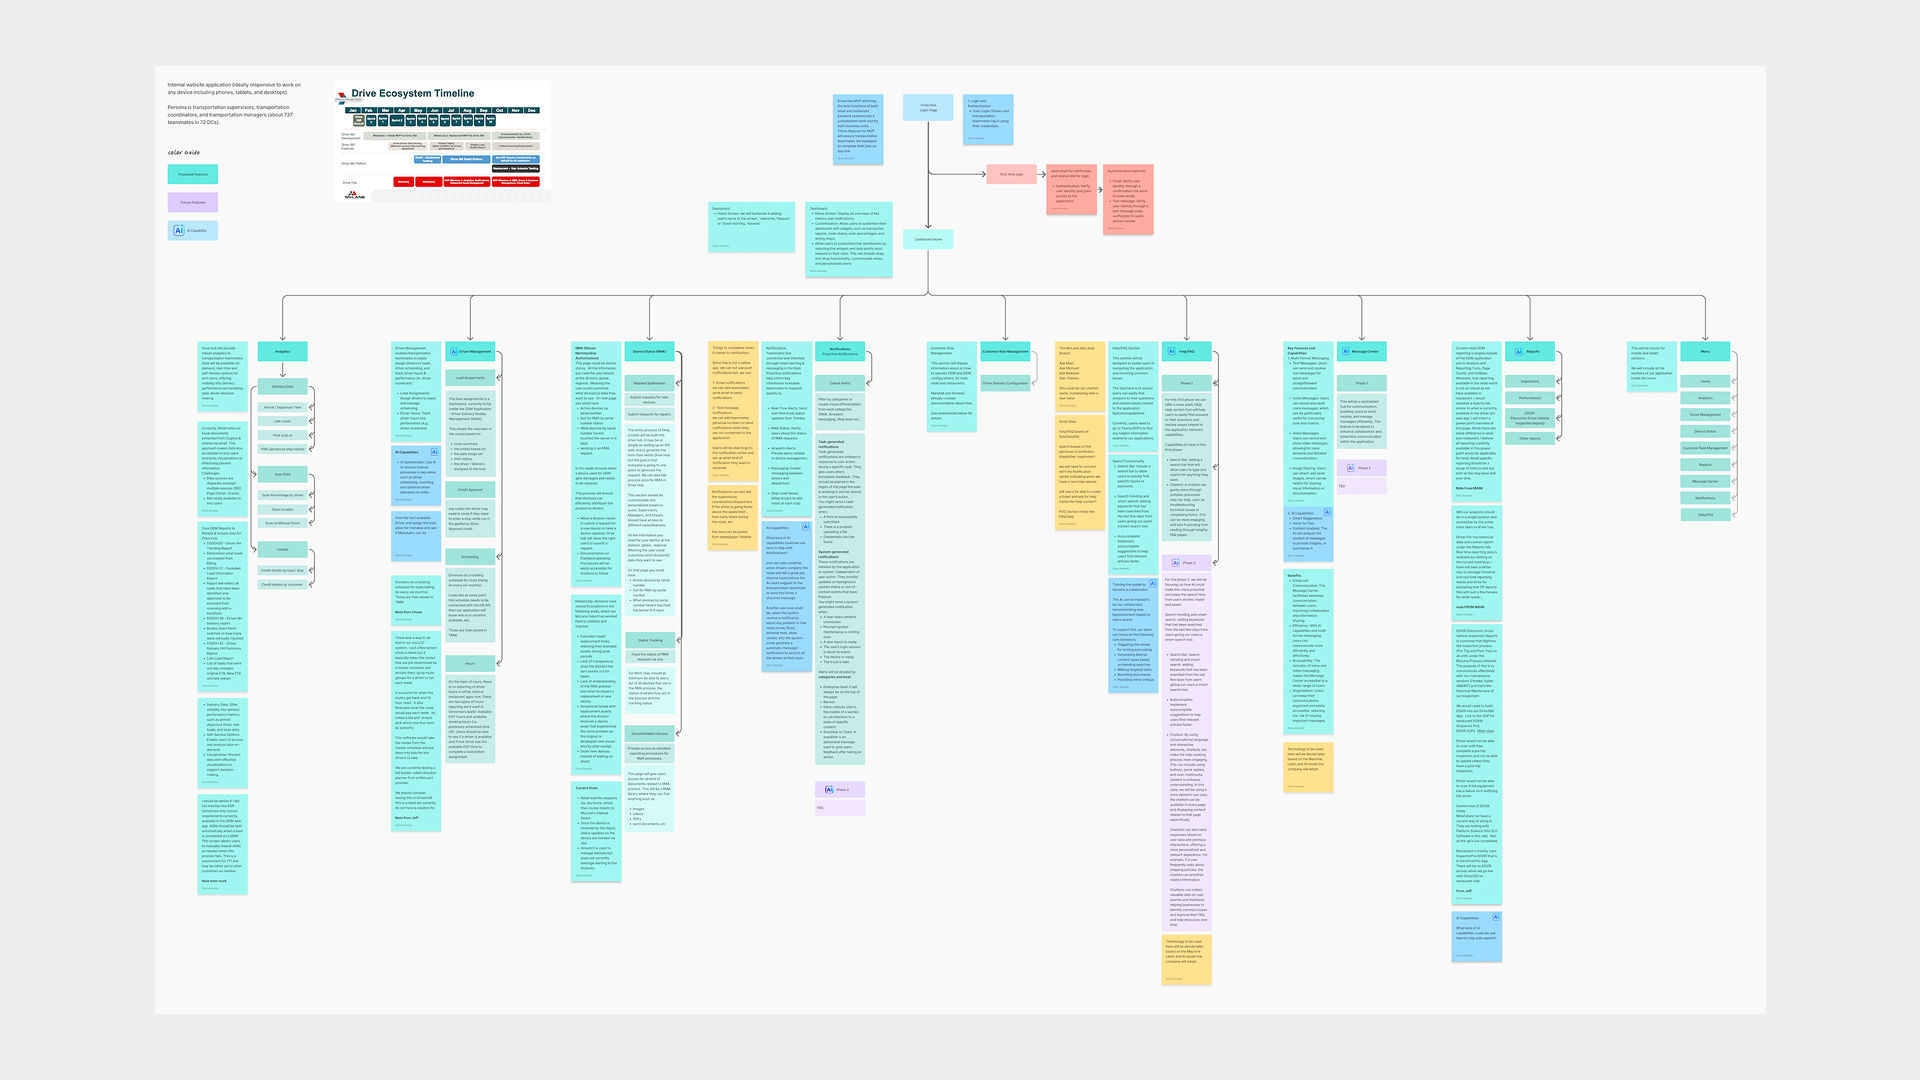
A master flow across nine functional areas — entry points, authentication, registration, home & route views, sites, alerts, menu, feedback — with sub-flows exposing every transition and dead end. This became the team’s shared model of the experience and the anchor for every scope decision.
Gap & severity audit
I catalogued 34 open gaps and ranked them critical / important / nice-to-have, so the team could sequence work by impact instead of by whoever shouted loudest. Seventeen gaps were identified and prioritized before a single screen was built.
Field & stakeholder input
Conversations with transportation supervisors and DC operations leaders surfaced the functional and emotional friction — the anxiety of an unresolved credit, the stress of a late load with no way to notify the customer, the frustration of pulling data from three systems to answer a basic question.
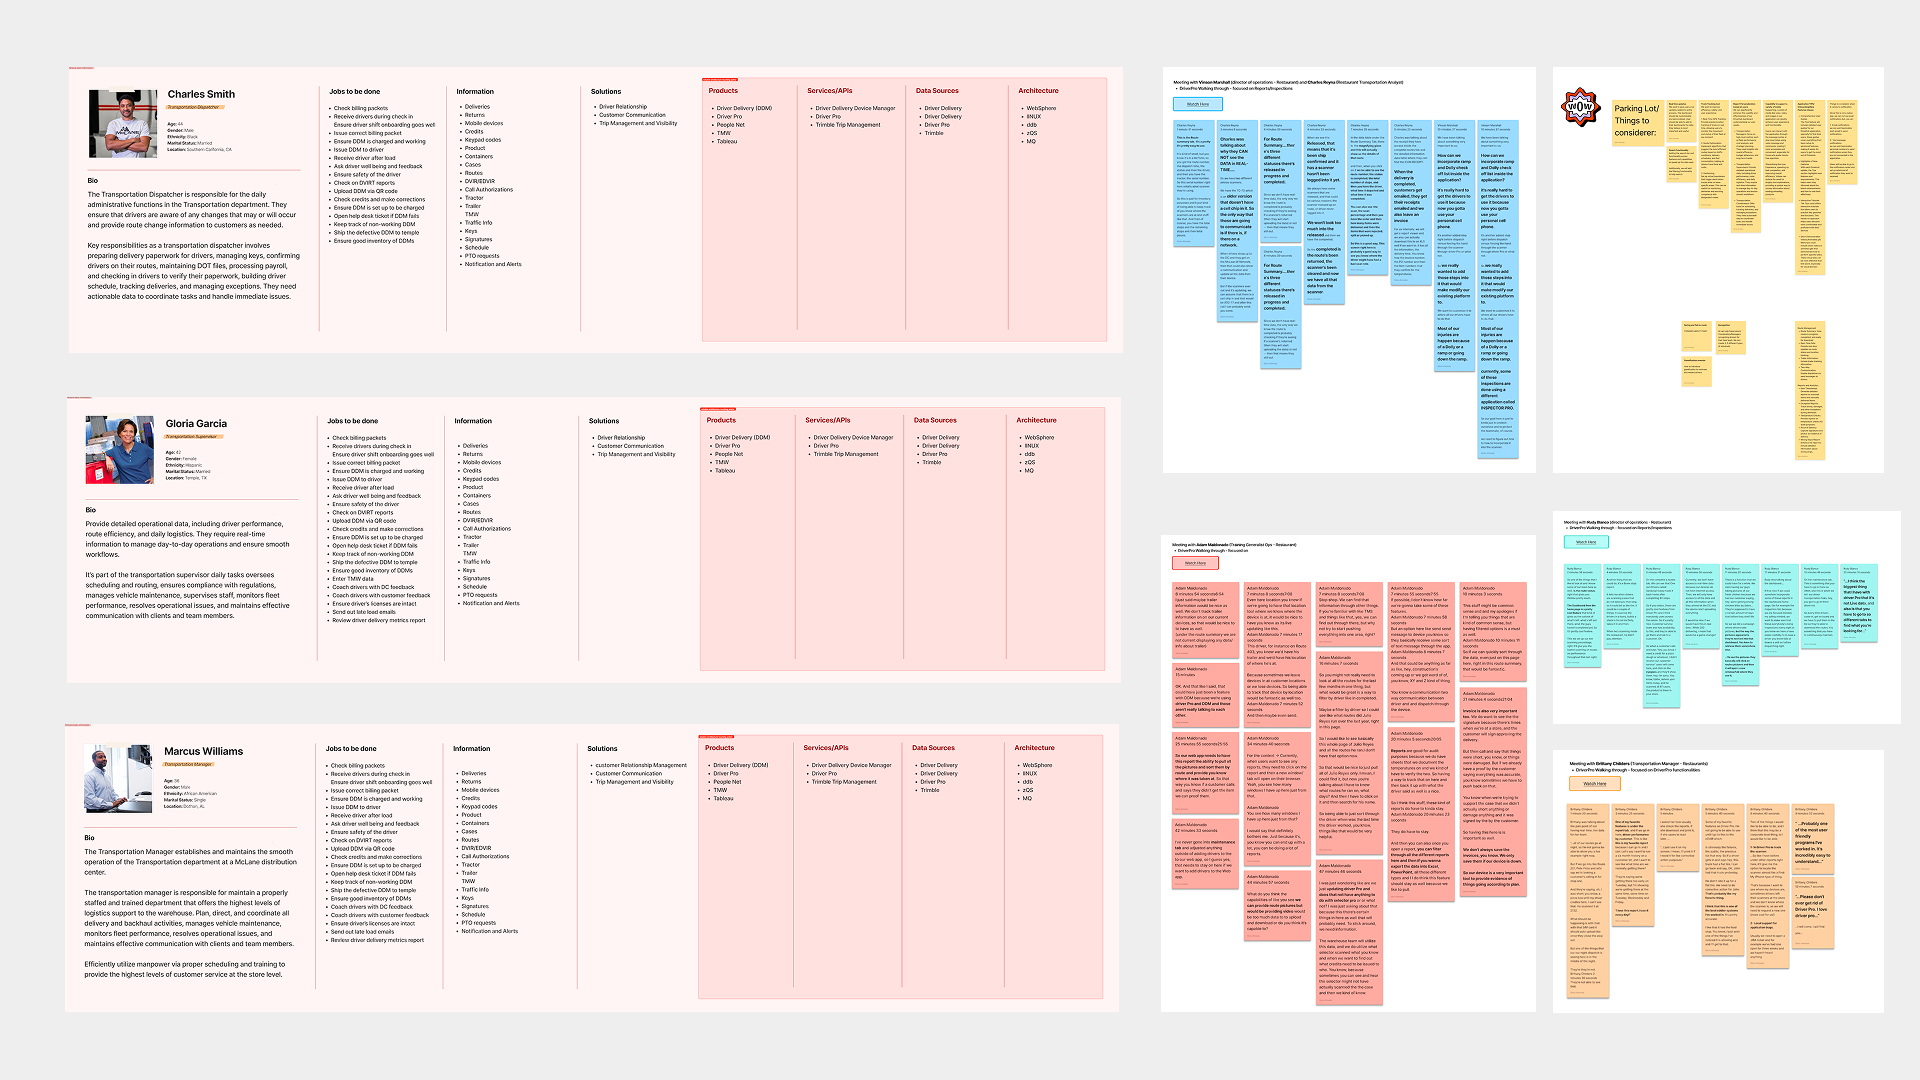
Personas — who DriveHub is built for
Three distinct archetypes emerged from research. Charles Smith, a Transportation Dispatcher, handles billing, driver check-in, QR codes, and EDM submissions — he needs accuracy and speed on administrative tasks. Gloria Garcia, a Transportation Supervisor, is the operational connective tissue between drivers and customers: she manages route execution, resolves exceptions, coaches drivers, and keeps customers informed in real time. Marcus Williams, a Transportation Manager, oversees the full DC — staffing, fleet, compliance, and cross-functional visibility. Every module in DriveHub was designed against one of these three — mapping what they need to see, when they need to act, and how much cognitive load they can carry mid-shift.
I used FigJam’s AI to cluster observations into affinity maps, then used Claude to interrogate the clusters — separating symptoms from root causes and turning a wall of notes into a ranked, defensible gap list the team could act on. What would have taken three workshop sessions took one afternoon.
Approachdesign in the flow of work — and make it intelligent.
I advocated for a user-centered approach built on three principles that guided every decision:
- Meet teammates in the flow of work — surface the right capability where the task already is, not in a separate tool that requires a detour.
- Make the invisible visible — route performance, credit anomalies, customer sentiment, and late-load patterns should surface automatically, not require manual digging.
- Let AI carry the cognitive load — supervisors shouldn’t have to remember to check for problems; the platform should proactively surface them and recommend next steps.
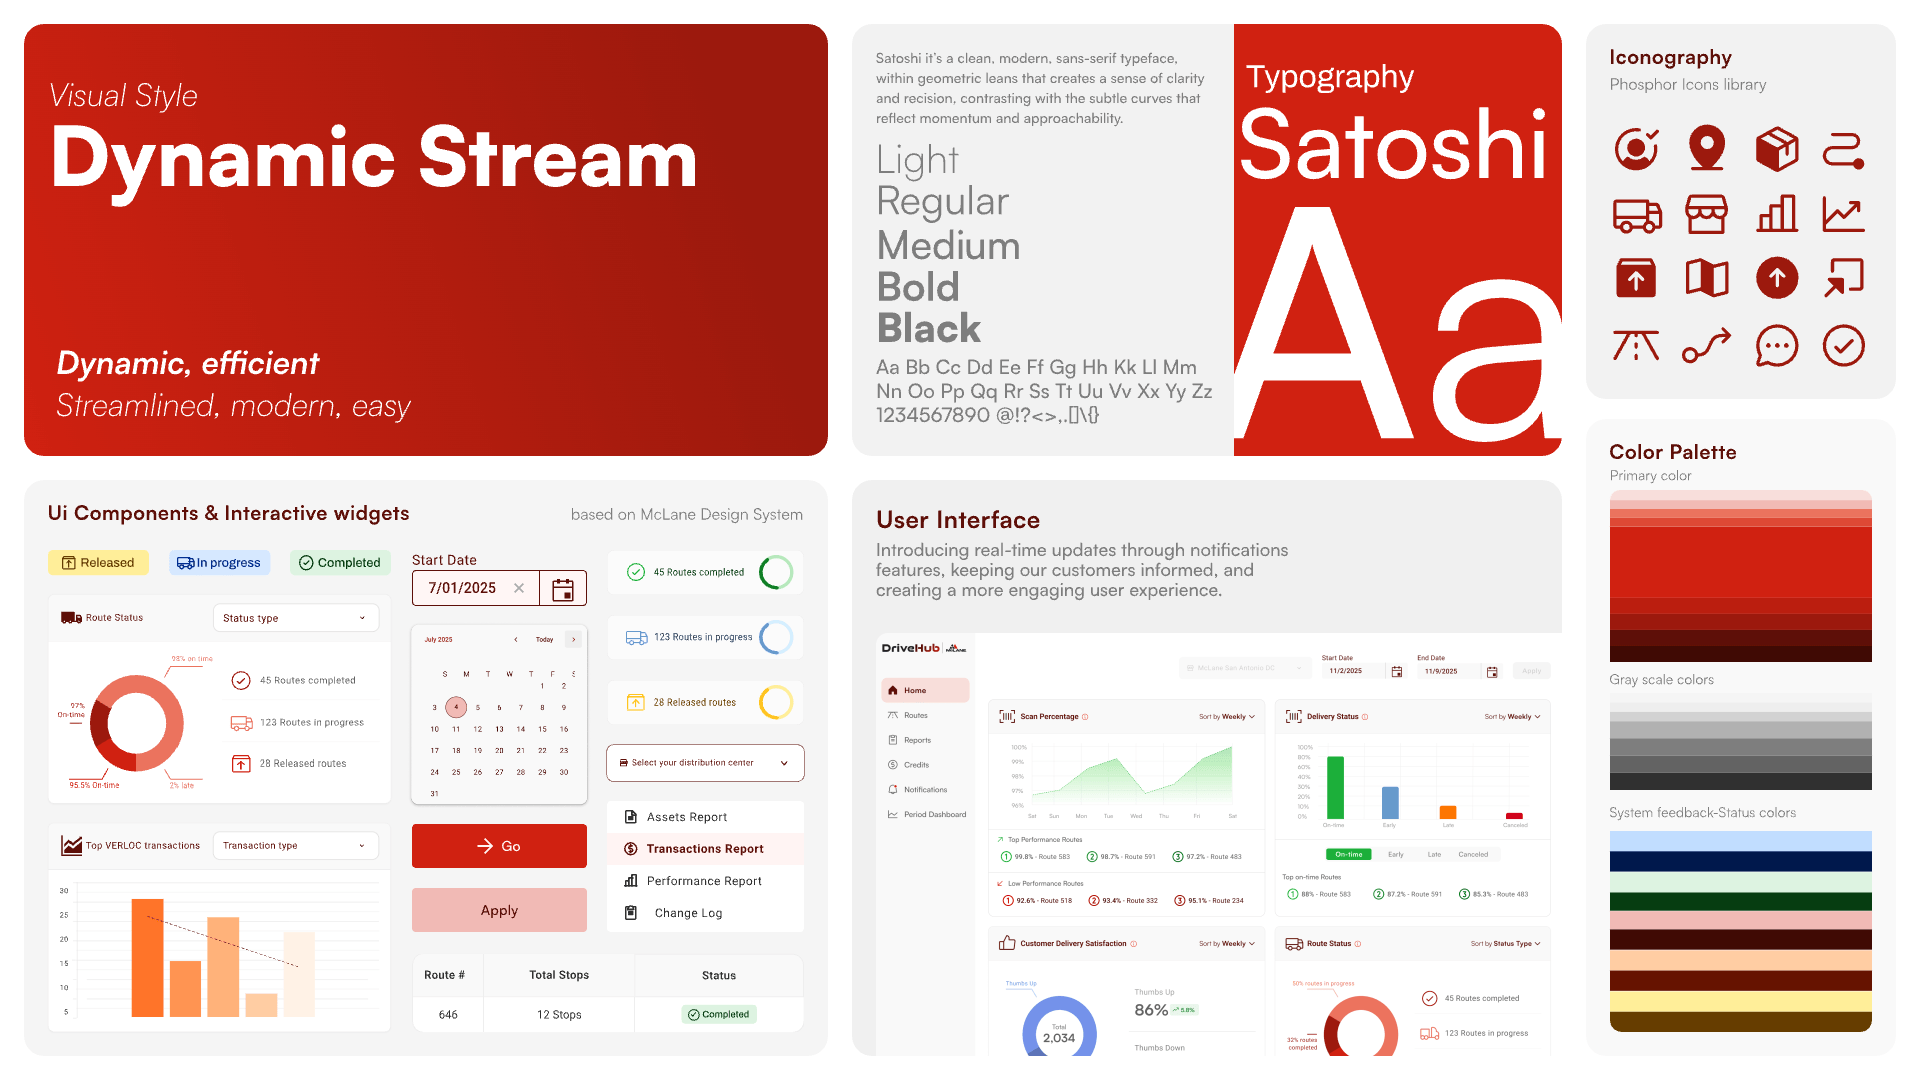
To make a sprawling platform feel like one experience, I invested early in a tokenized design system. Every color, type style, spacing value, and icon traces back to a named token — McLane red, Satoshi for content, Archivo for actions, Phosphor icons throughout. That system is what lets the home dashboard and the credits workspace and the weather alert panel all feel like rooms in the same house.
I used Claude to rapidly explore alternative flows for harder design problems — the credit dispute lifecycle, the late-load notification model, and the AI copilot interaction pattern. I used Figma AI to draft UI layouts quickly, then refined every frame by hand against the token system. For the high volume of UX writing DriveHub demanded — status labels, dispute-state messaging, alert copy, empty and error states — I used Claude to generate first drafts, then edited for operational accuracy.
Designten connected modules, one intelligent platform.
DriveHub gives transportation supervisors a complete operational view — from the first route of the day to the last credit resolved at night. AI is woven into every layer: surfacing insights, flagging anomalies, recommending actions, and answering questions in plain language.
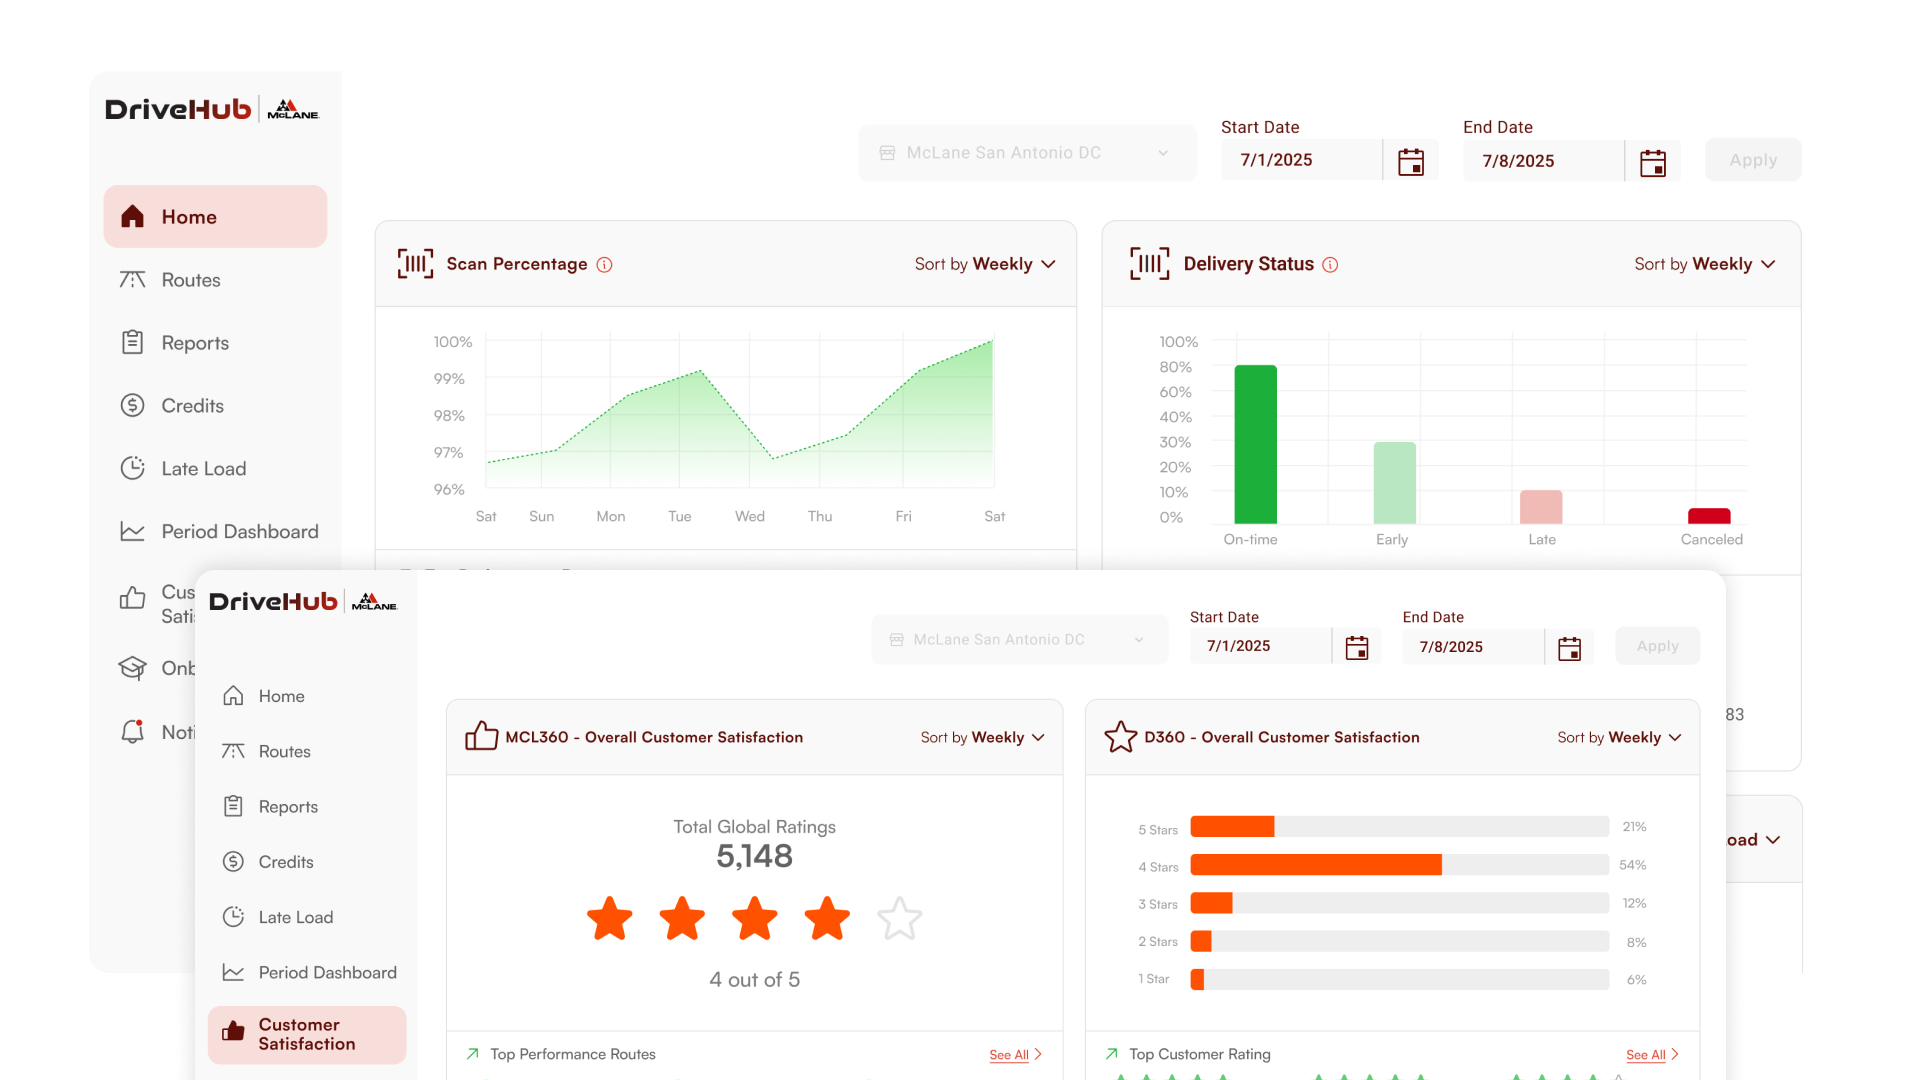
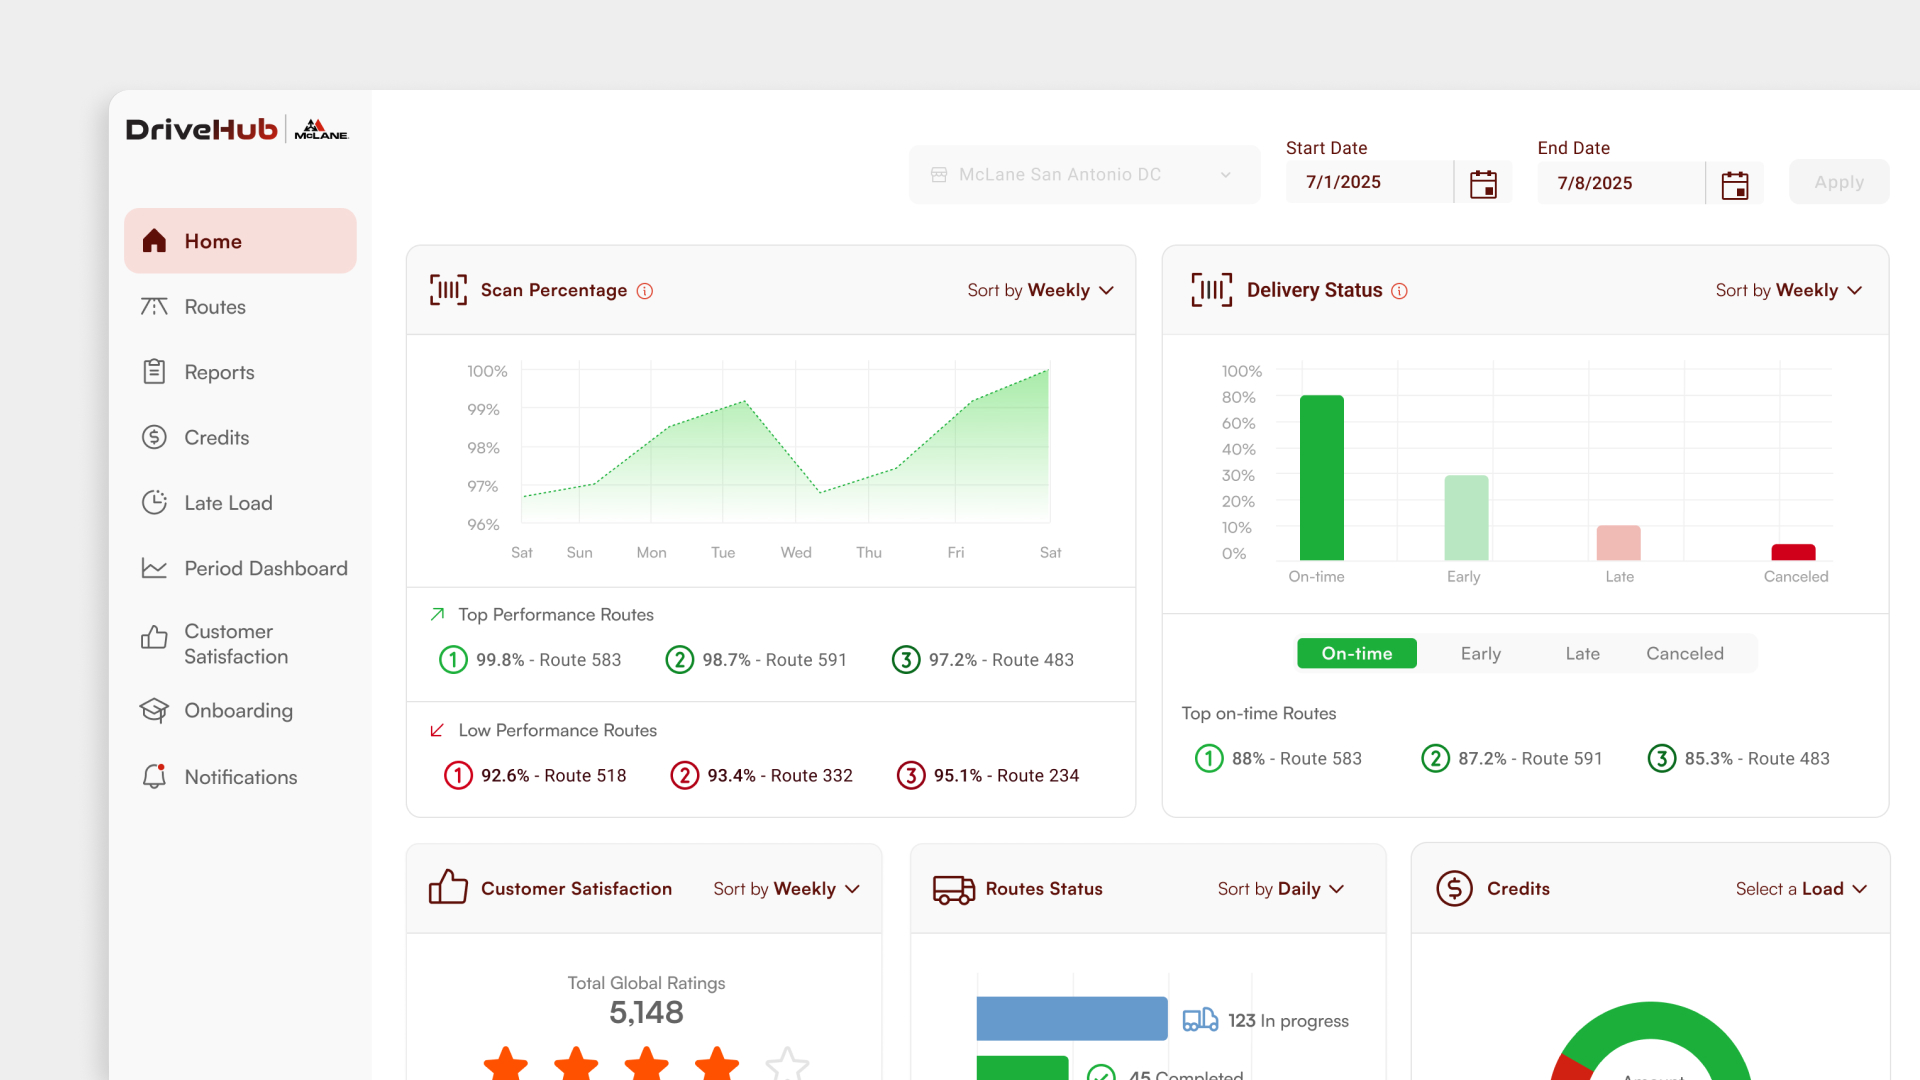
01 · Home Dashboard — intelligence at a glance
The home screen is the operational nerve center. At a glance, supervisors see Scan Percentage trends, Delivery Status breakdowns (on-time / early / late / canceled), Customer Satisfaction scores, Routes Status, and a Credits widget per load. Every KPI links to its detail view. The AI copilot surfaces when new credits arrive that need approval — it reads the data against historical baselines and tells the supervisor: “None of these appear critical or anomalous — do you want me to approve all?” The supervisor decides; the AI does the analysis.
Contextual copilot proactively reviews pending credit loads against historical data, flags anomalies, and offers bulk-action suggestions — reducing the time spent auditing routine approvals.
02 · Routes Management — every load, always visible
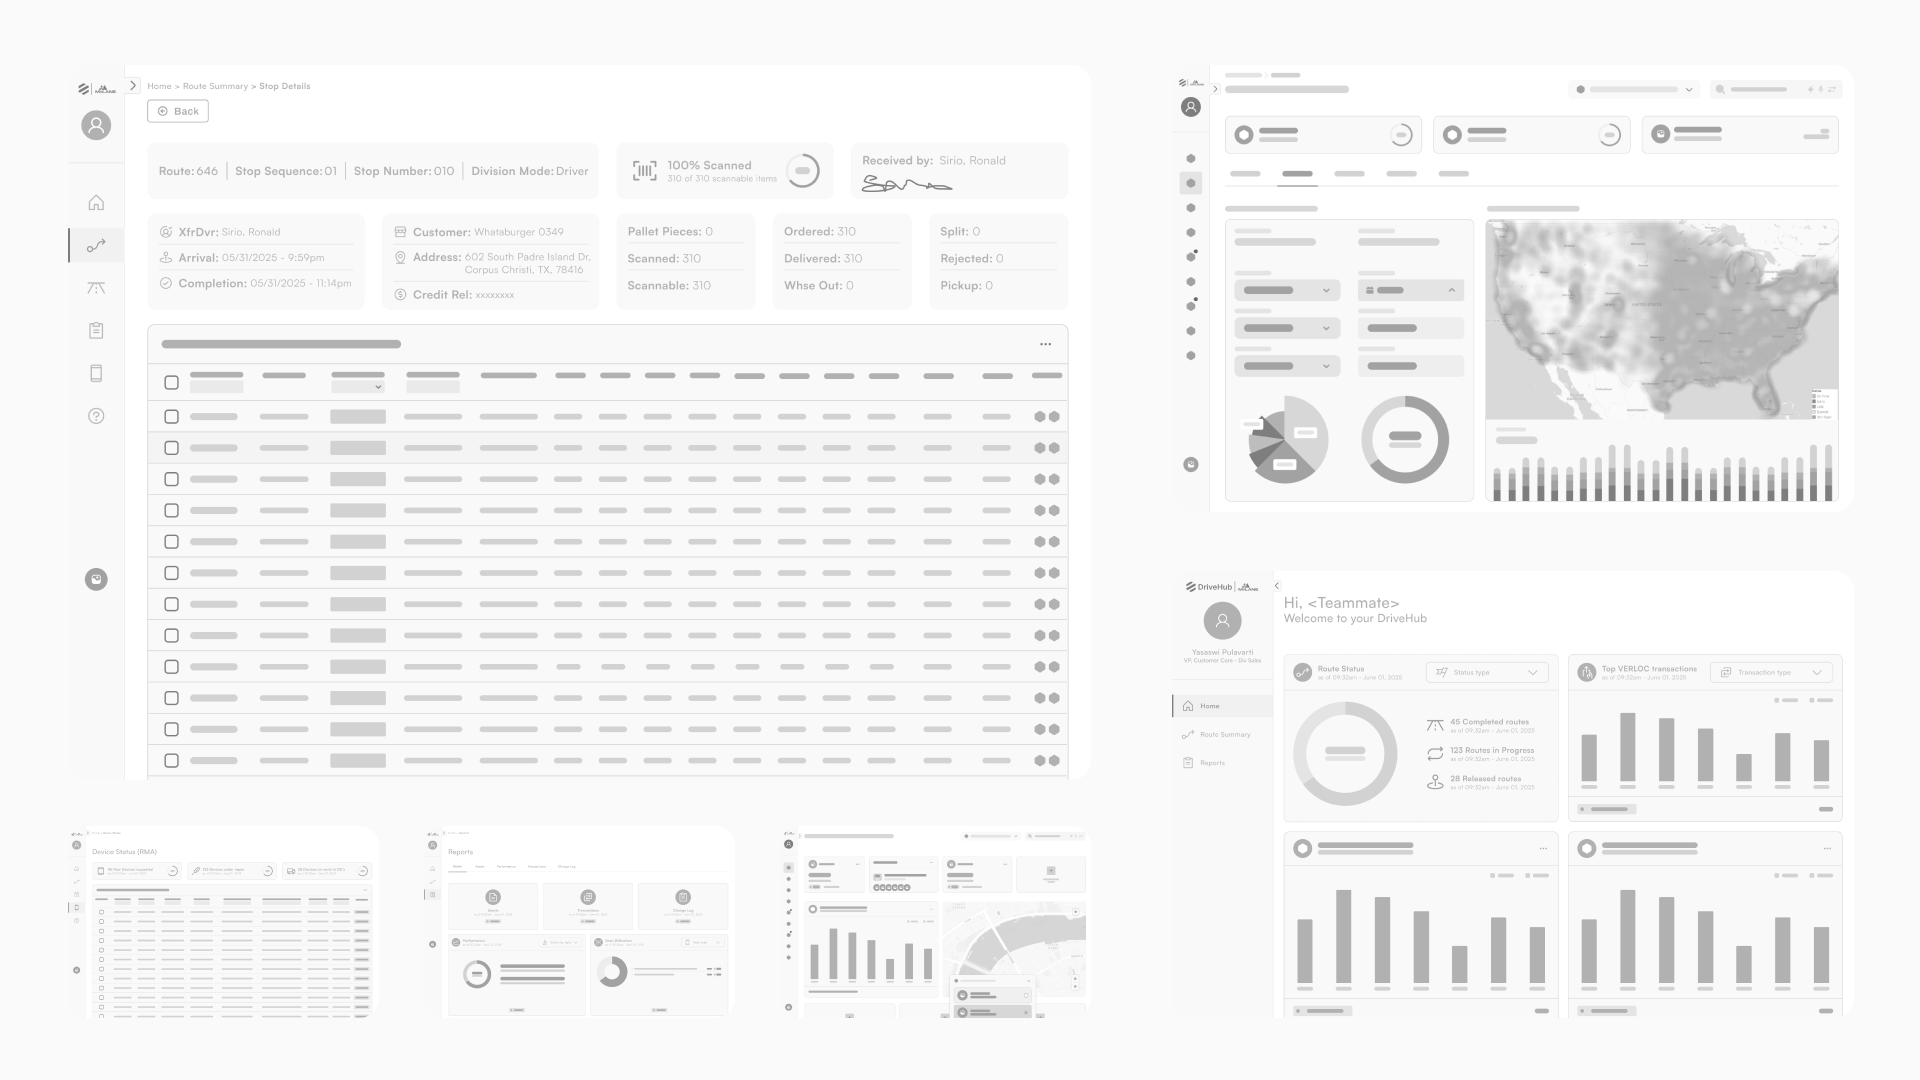
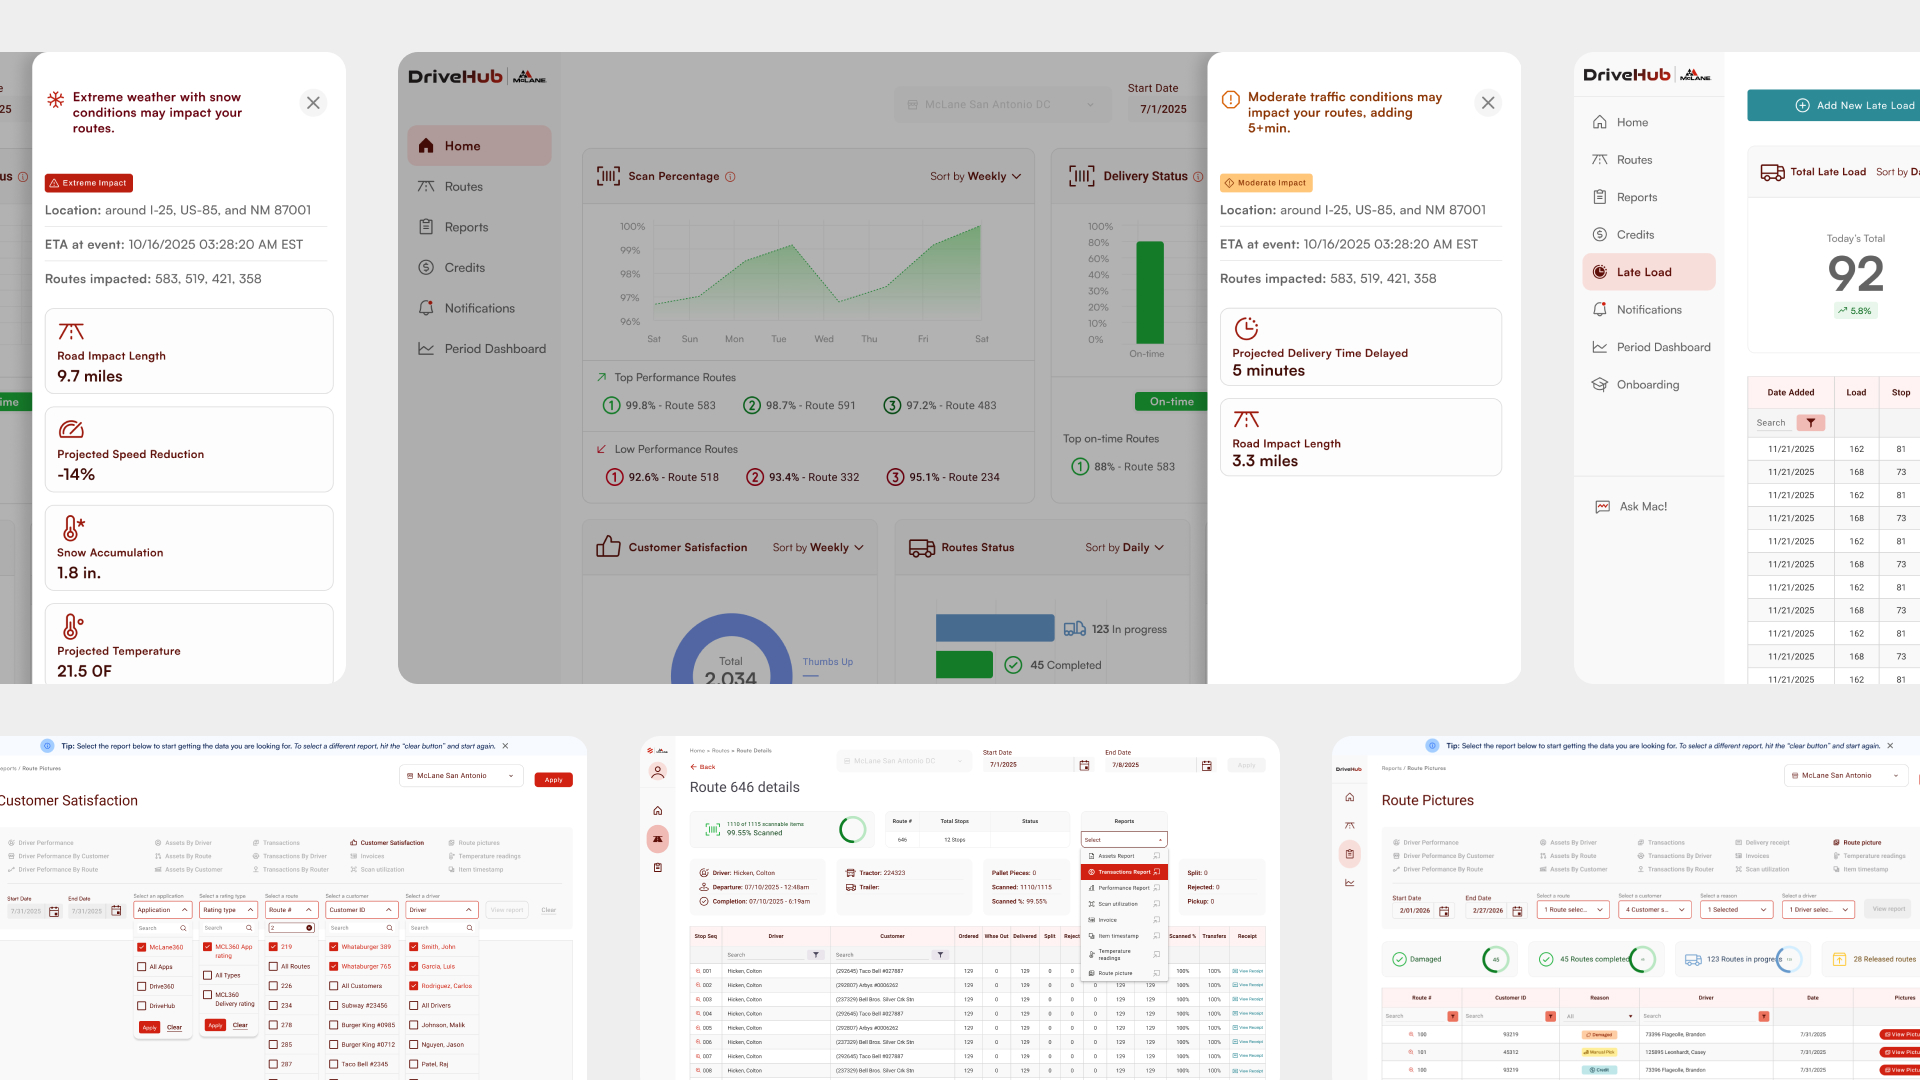
A live table of every route with driver name, trailer, tractor, dispatch date, status, total stops, scanned pieces, rejected pieces, and completion percentage. Filters, search, and sortable columns let a supervisor find any route in seconds. One click reaches route-level detail; from there, individual stop detail.
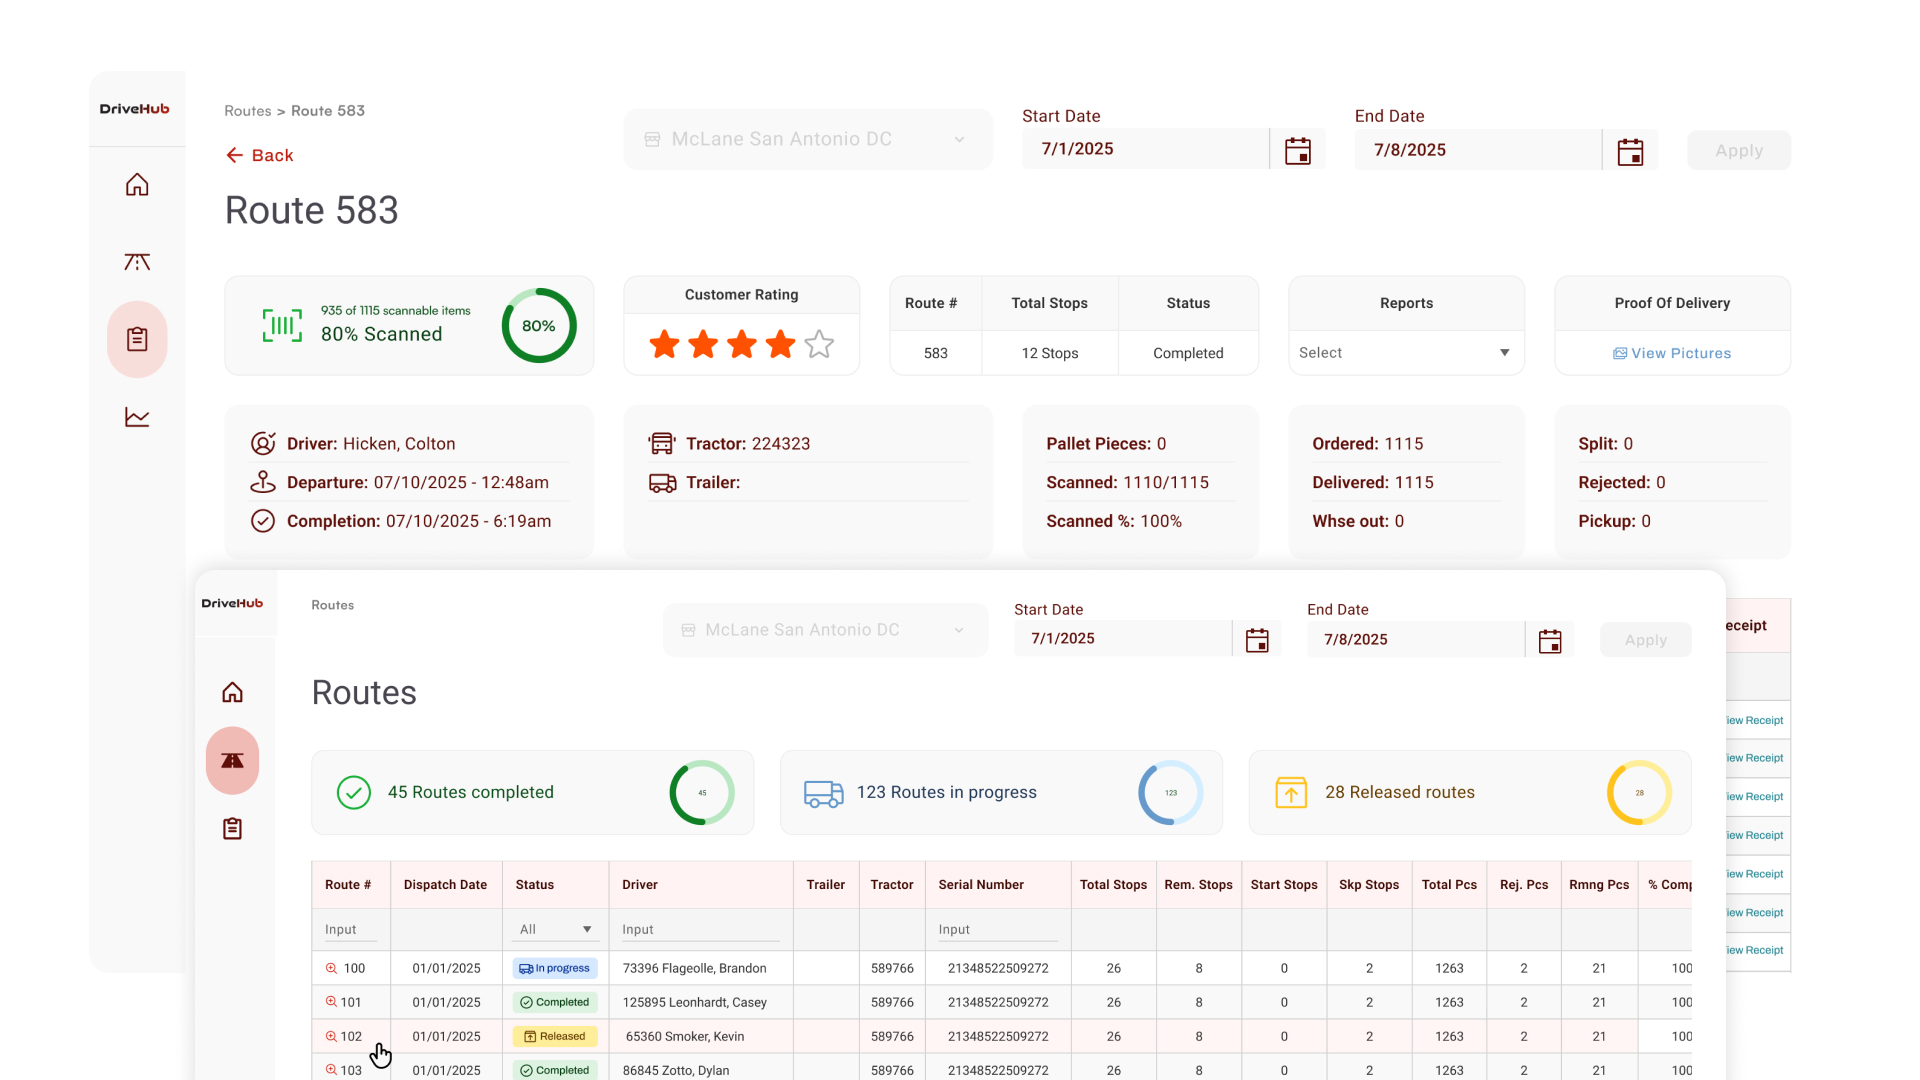
03 · Stop Details & Item-Level Tracking — the truth at every delivery
At the stop level, supervisors see the complete delivery record: scan completion rate, customer name and address, arrival and completion timestamps, credit relevance, and a line-by-line item table showing ordered, delivered, split, rejected, and warehouse-out quantities per SKU. Discrepancies surface immediately — not days later in a reconciliation report.
04 · Proof of Delivery (POD) — photographic evidence at every level
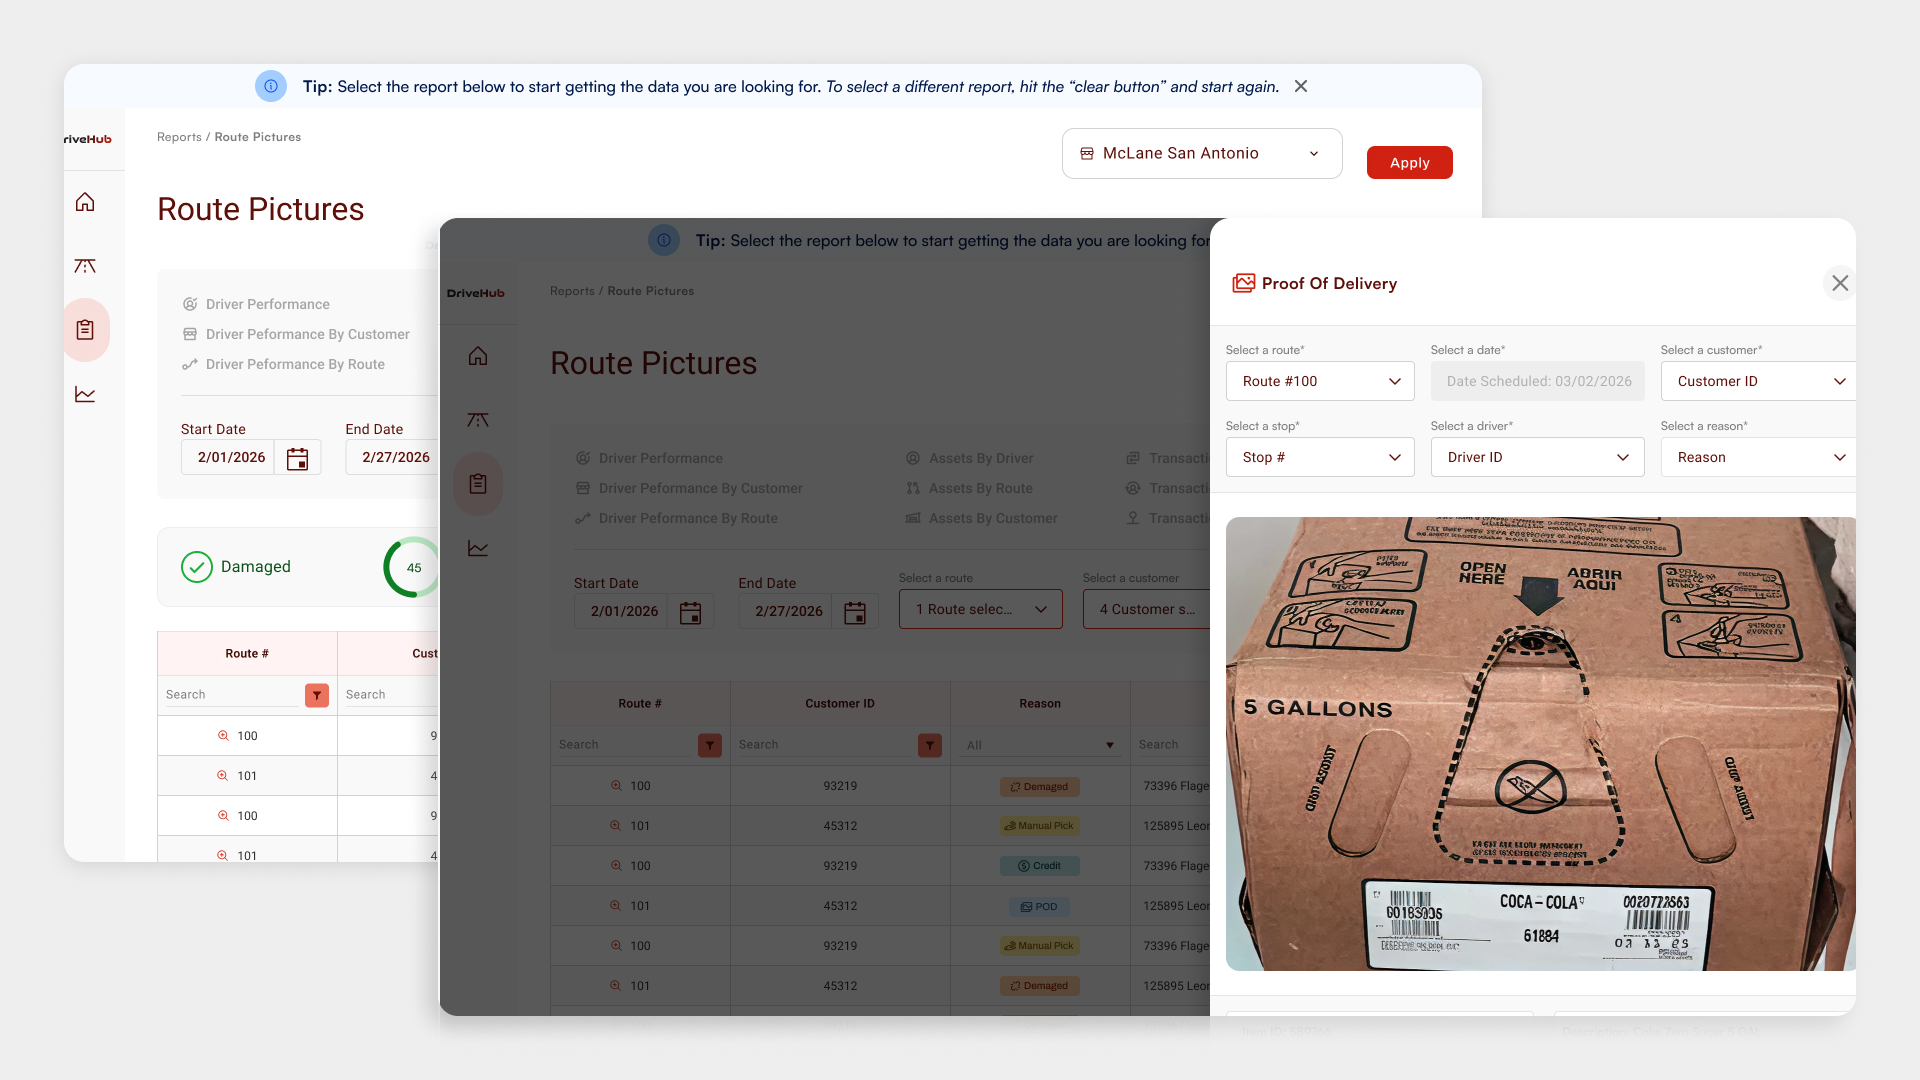
The POD module surfaces delivery photos at three levels: route, stop, and individual item. Supervisors can navigate a gallery with item ID and description context, and filter by route, stop, driver, date, customer, and reason code. For credits or disputes, the photo is the primary evidence — always one click from the record that raised the flag.
05 · Credits & Disputes — an AI-assisted lifecycle for every claim
The Credits module replaces phone calls and spreadsheets with a structured, auditable workspace. KPI cards show total credit amount, credited vs. uncredited split, and AI-generated trend callouts surfaced directly in the UI. A real-time banner alerts supervisors when new credits arrive. The dispute path includes SLA tracking, routing, hold-on-funds, and a complete audit trail.
An embedded AI assistant on the Credits screen answers natural-language questions in context — “Compare credited amounts per region,” “List customers with pending credits over $500,” “Show missing credit entries from yesterday” — without requiring the supervisor to build a custom filter or export a report. The AI also auto-generates trend insights, flagging when a specific credit reason code is trending upward.
06 · Late Load Management — proactive, not reactive
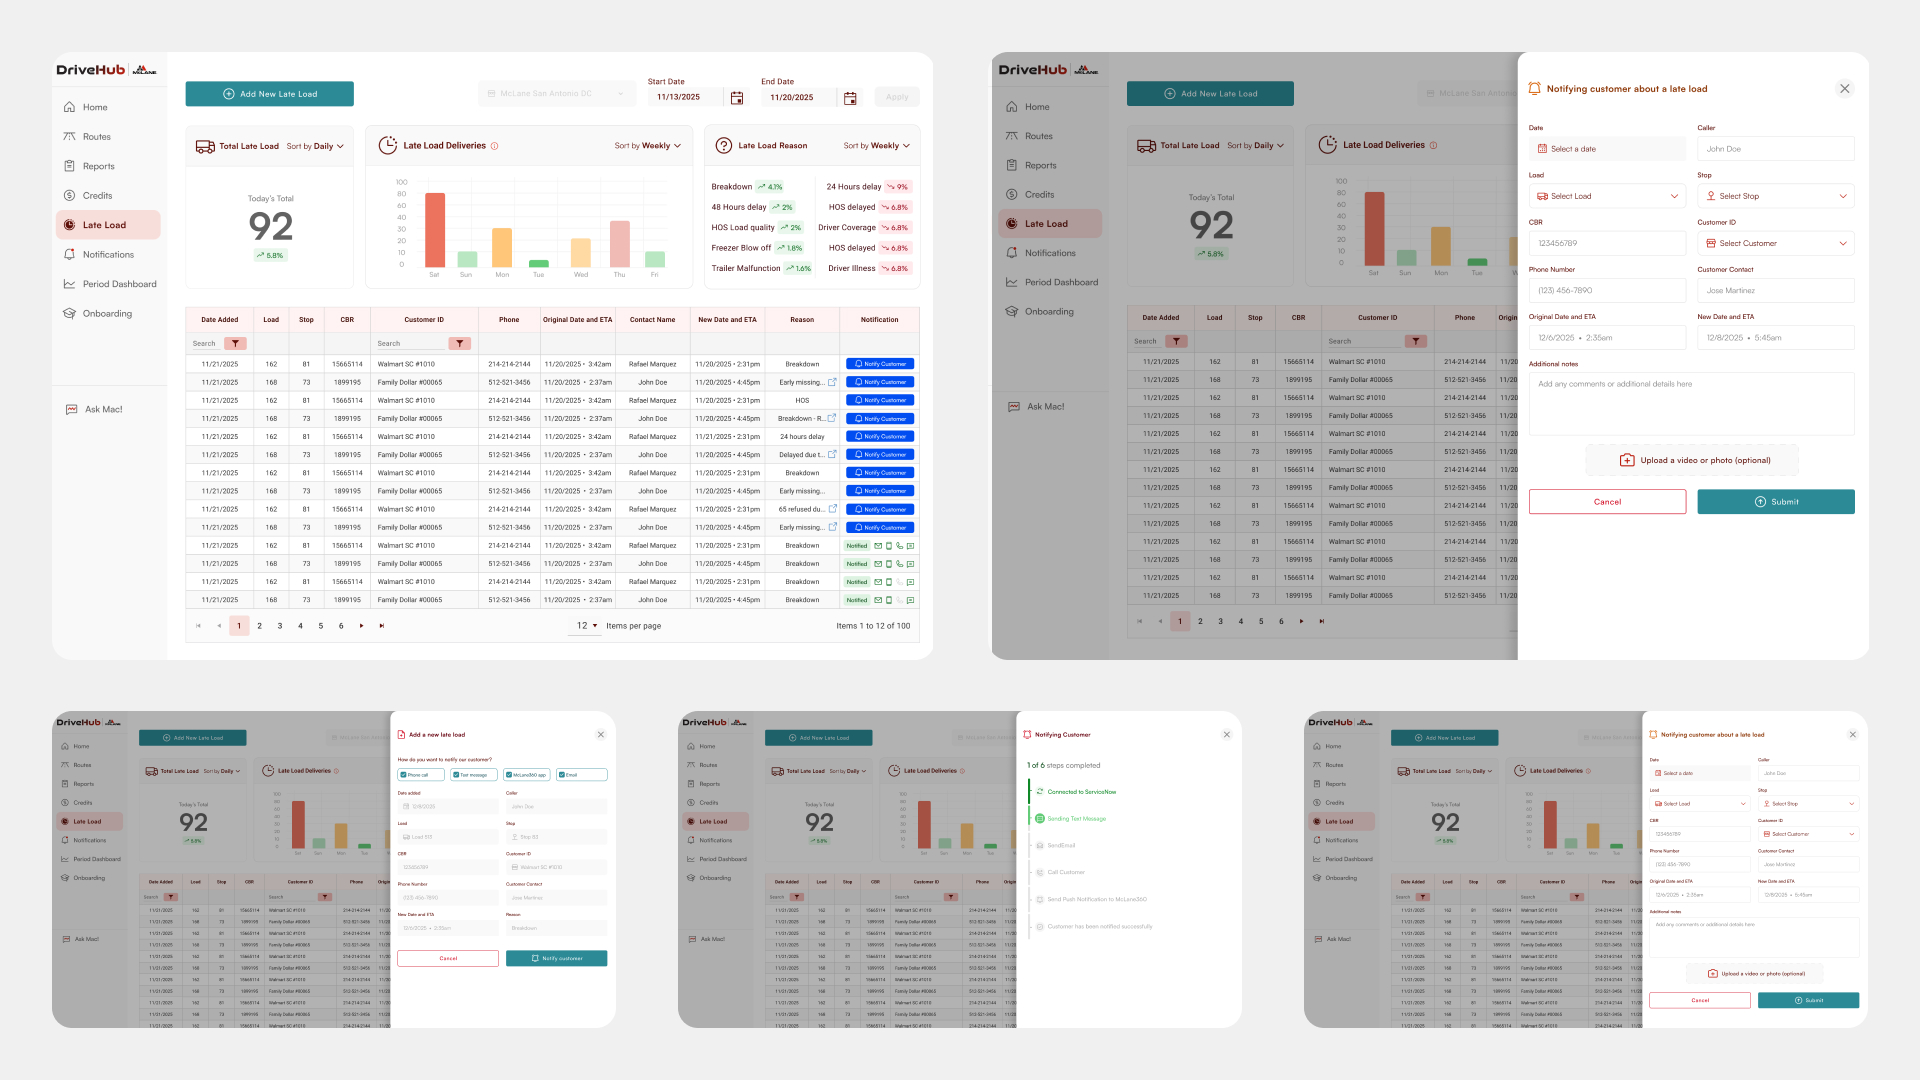
Supervisors see a live count of today’s late loads, a weekly trend chart, and a reason breakdown (Breakdown, HOS, Freeze Blow-Off, Trailer Malfunction, Driver Coverage, Driver Illness). For each late load, a supervisor can log the reason, update the ETA, and notify the customer directly from within the platform — with notification status tracked per record.
07 · Real-Time Alerts — traffic & weather intelligence
Banner alerts surface the moment external conditions may impact routes. Traffic and weather alerts are prioritized by severity and include a detail modal with affected routes and recommended actions. Alerts are dismissible and don’t persist after acknowledgement — keeping the dashboard clean for the next priority.
08 · Customer Satisfaction — close the feedback loop
Aggregates ratings from both the MCL360 and D360 apps into a single supervisor view: overall star score, top and bottom performing routes, and per-customer breakdowns across Overall Experience, Delivery Speed, On-Time Delivery, Communication, Organization, Cleanliness, Efficiency, Driver Friendliness, and Receipt Details.
09 · Reports — self-service analytics for every need
The Reports hub gives supervisors access to 15 pre-built report types: Driver Performance, Assets, Transactions, Delivery Receipt, Invoices, Scan Utilization, Route Pictures, Temperature Readings, and Item Timestamp. Filterable by distribution center and date range. No tickets, no waiting.
10 · Ask Mac! — the AI assistant that runs the whole platform
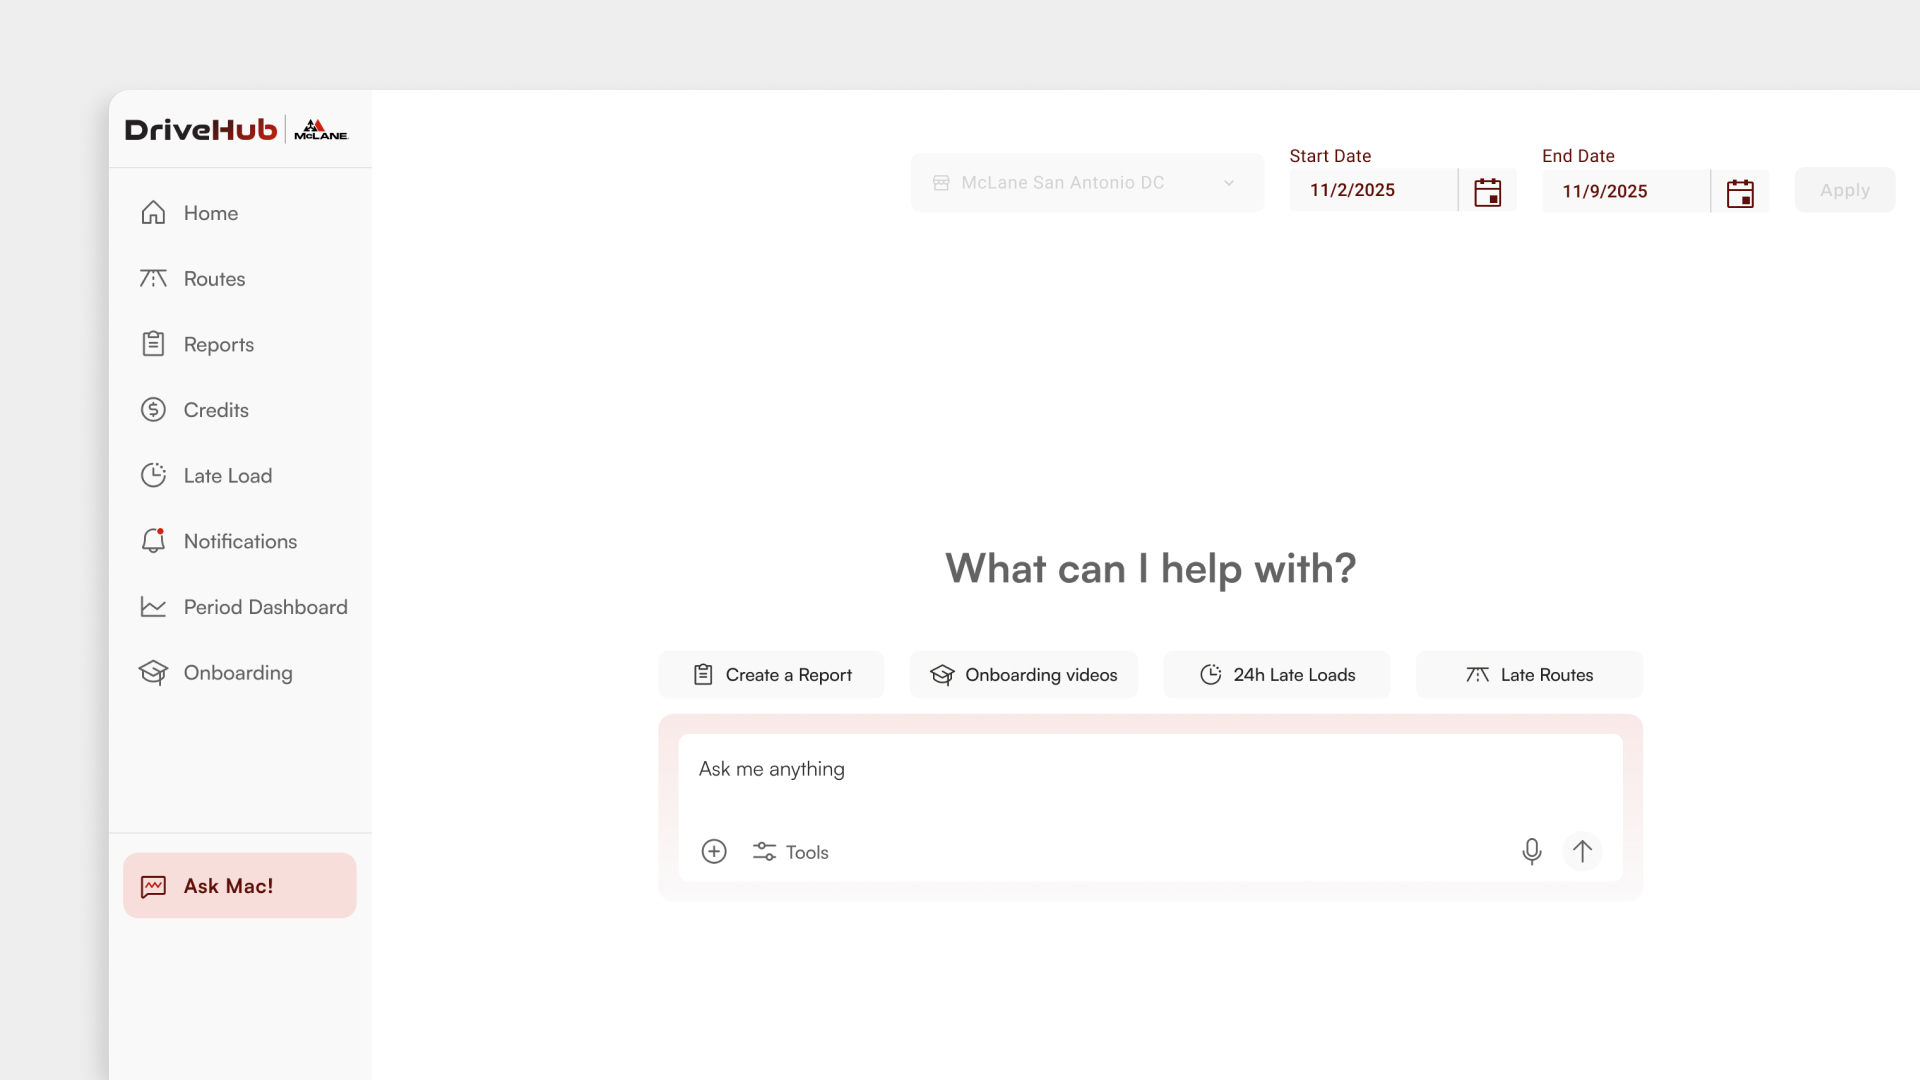
A conversational AI assistant embedded in DriveHub’s global navigation. Supervisors can type or speak any question and the assistant either surfaces the data directly or navigates to the right module. Quick-action chips cover the most common tasks. Voice input is available for hands-free use in dock environments.
Ask Mac! combines platform navigation, data retrieval, and operational guidance in one interface — making the entire platform discoverable through conversation and lowering the learning curve for new teammates.
Design system — the foundation that makes it all cohere
Every module above is built on the same tokenized foundation: McLane red as the primary action color, Satoshi for body content, Archivo for interactive labels and CTAs, Phosphor icons throughout, and a Kendo-based spacing scale. Because every decision traces back to a named token, every module feels like it belongs to the same product.
"The goal was never to digitize the old forms. It was to design around the supervisor’s day — so the right information is already there at the moment they need it, and the platform never slows the team down."
Outcomesa platform the operations team actually wants to open.
DriveHub replaced a fragmented toolset with a single, coherent, AI-assisted operations platform, with measurable results across credits, returns, and delivery operations:
Business impact
- Faster, smarter credit resolution — the AI-guided workflow now resolves 40% of credit requests fully autonomously and cuts overall resolution time by 30%, saving an estimated $3M a year.
- RMA turnaround dropped from 38 days to 12 — a two-thirds cut in how long a return takes to close.
- Delivery-delay support calls fell 52% — proactive alerts and in-platform customer notification replaced the reactive phone-tag loop.
- Smarter weather/traffic rerouting saves an estimated $2M a year in fuel.
- New-user training time dropped 28% — Ask Mac! and a design system built for discoverability shortened the ramp for new supervisors.
Lessonswhat designing DriveHub taught me.
AI earns trust by being specific, not impressive
The most effective AI features in DriveHub are the most specific ones — “None of these credits appear anomalous based on last year’s data” is more useful than a generic summary. Designing AI that is precise, contextual, and honest about its confidence is what makes supervisors trust it enough to act on it.
A system is what makes scale feel like one product
The tokenized design system was the highest-leverage investment. Ten modules feel unified because every decision traces to the same set of named tokens. Without it, consistency at this scale would require constant policing. With it, it is almost automatic.
Design for the constraint, not the demo
Transportation supervisors work under time pressure in noisy dock environments, making fast decisions with incomplete information. Designing for the hardest real conditions — not the ideal showroom case — is what made the flows actually usable.
Proactive beats reactive, every time
The biggest shift in DriveHub’s value came from moving from “report what happened” to “tell me what to do about it now.” Every AI feature — the copilot, the trend insights, Ask Mac! — is an expression of the same principle: the most useful thing a platform can do is surface the right action before the supervisor thinks to ask.
Use AI in your process to design better AI in the product
Using Claude and Figma AI in my own design process — for synthesis, flow exploration, and UX writing at scale — gave me a practical intuition for where AI adds value and where it gets in the way. That intuition directly shaped how I designed the AI layer in the product itself.
Conclusionfrom twelve tabs to one intelligent platform.
DriveHub reframed McLane’s frontline operations technology around the people running it. By replacing 12 disconnected tools with one platform — and embedding AI throughout to surface insights, flag anomalies, and recommend actions — transportation supervisors went from reactive firefighting to proactive control.
The work taught me that the best AI features are the ones that feel invisible: not because they hide, but because they fit so naturally into the flow of work that using them feels like the obvious thing to do. That’s the standard I bring to every product I touch.